With the tool Phase Manager you can create construction phase maps (“flipbook”). Construction phase maps show on the site plan, at which location, which work is carried out in which time period.
So far so good. But what is special about Phase Manager?
- Phase Manager is easy to use and you do not need a CAD draftsman or 3D modeler to work on the construction phase map
- Phase Manager is based on your schedule: Chaning the Schadule dates result in a modified construction phase map at the push of a button.
- Phase Manager includes automated legends for colors, calendars, time scales and other annotation functions. The documentation of the construction phase map is thus also automated and you get fast and high quality results.
- Reliability and digitalization: Phase Manager automates the manual and therefore error-prone process of creating building plans.
Here are some results of real projects as animated graphics, all created with Phase Manager:
(to enlarge please click on the pictures)
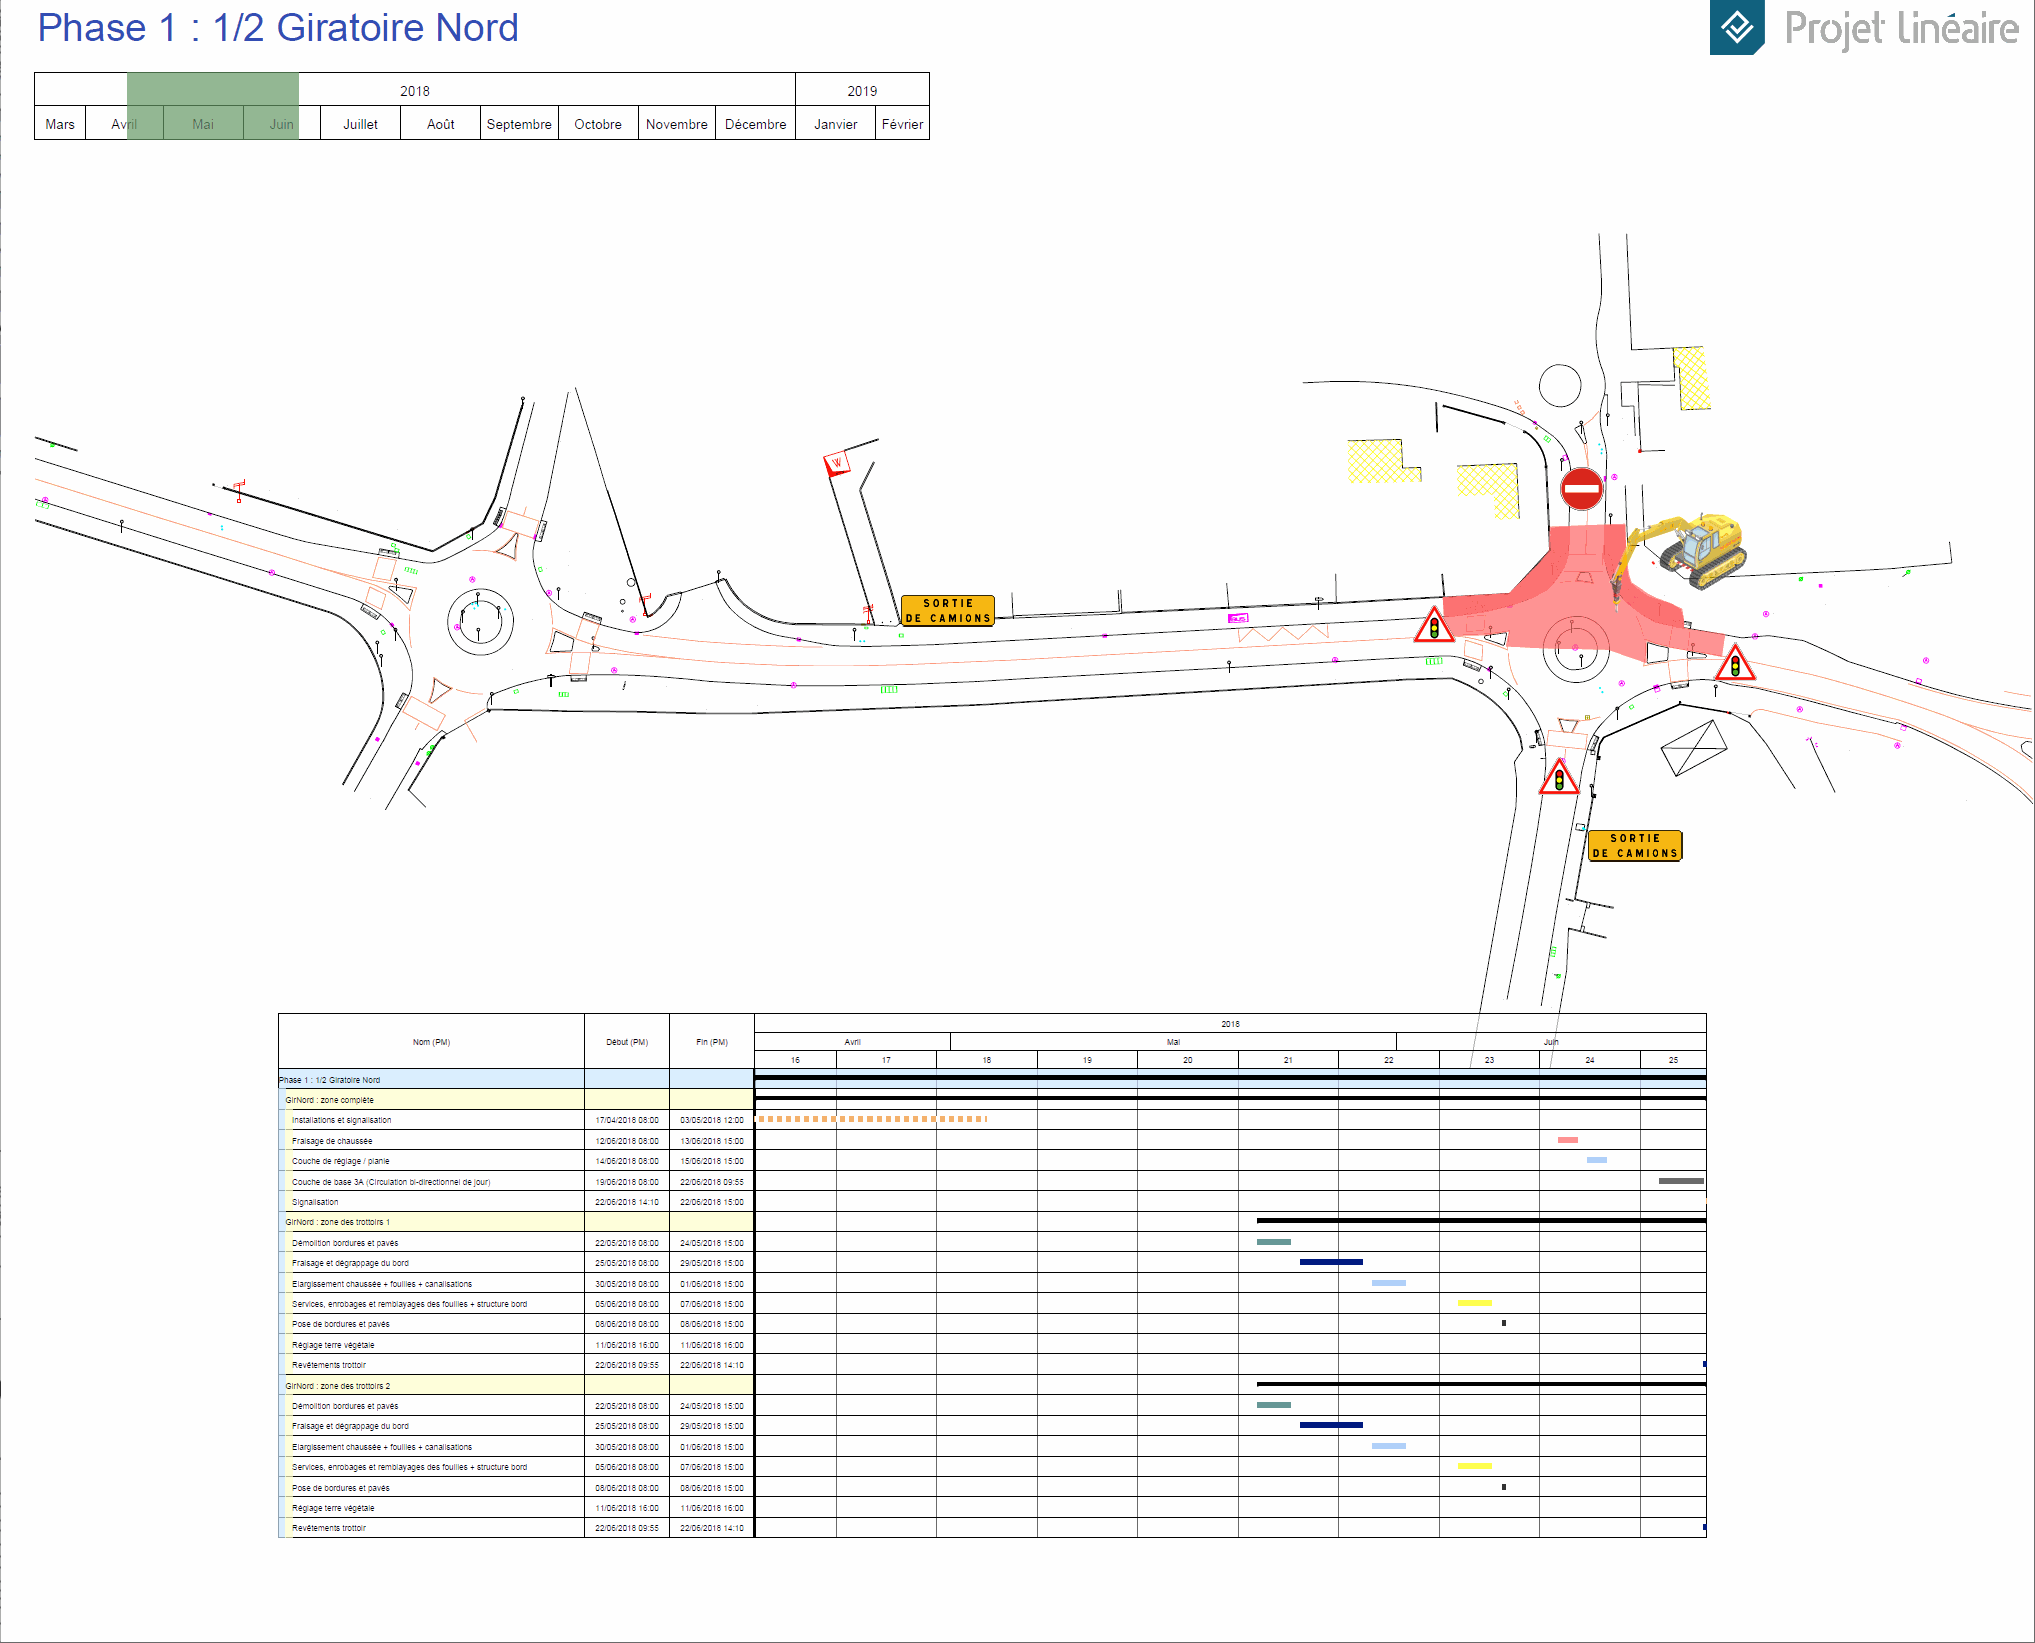
Construction phase map in Road Construction
Project:
Due to liability problems on the road, the right-hand roundabout of the opposing projects had to be rehabilitated. The construction of a retaining wall and the retrofitting of sidewalks and curbs were included in the program.
The work was scheduled in Tilos and this task data was transferred to Phase Manager.

Top: Phase map of six Phases

Bottom: Daily “flipbook” of the work to be done.
Phase map of Railway Enhancement:
Project:
Railway station and track works under traffic: Track ballast renewal, sleeper renewal, rail renewal, replacement of switches, roadway replacement, underpass construction, extension of the station building ….
The work was scheduled in Tilos and this task data was transferred to Phase Manager.
At this freight yard, the customer wanted to check if the train service was possible for the whole duration of the project and under what conditions.
You need to create the data for these different outputs only once. With the output you decide, which representation you want to see. Phase Manager automatically creates the information you want (for example, phase plan, daily report, weekly report, construction situation).
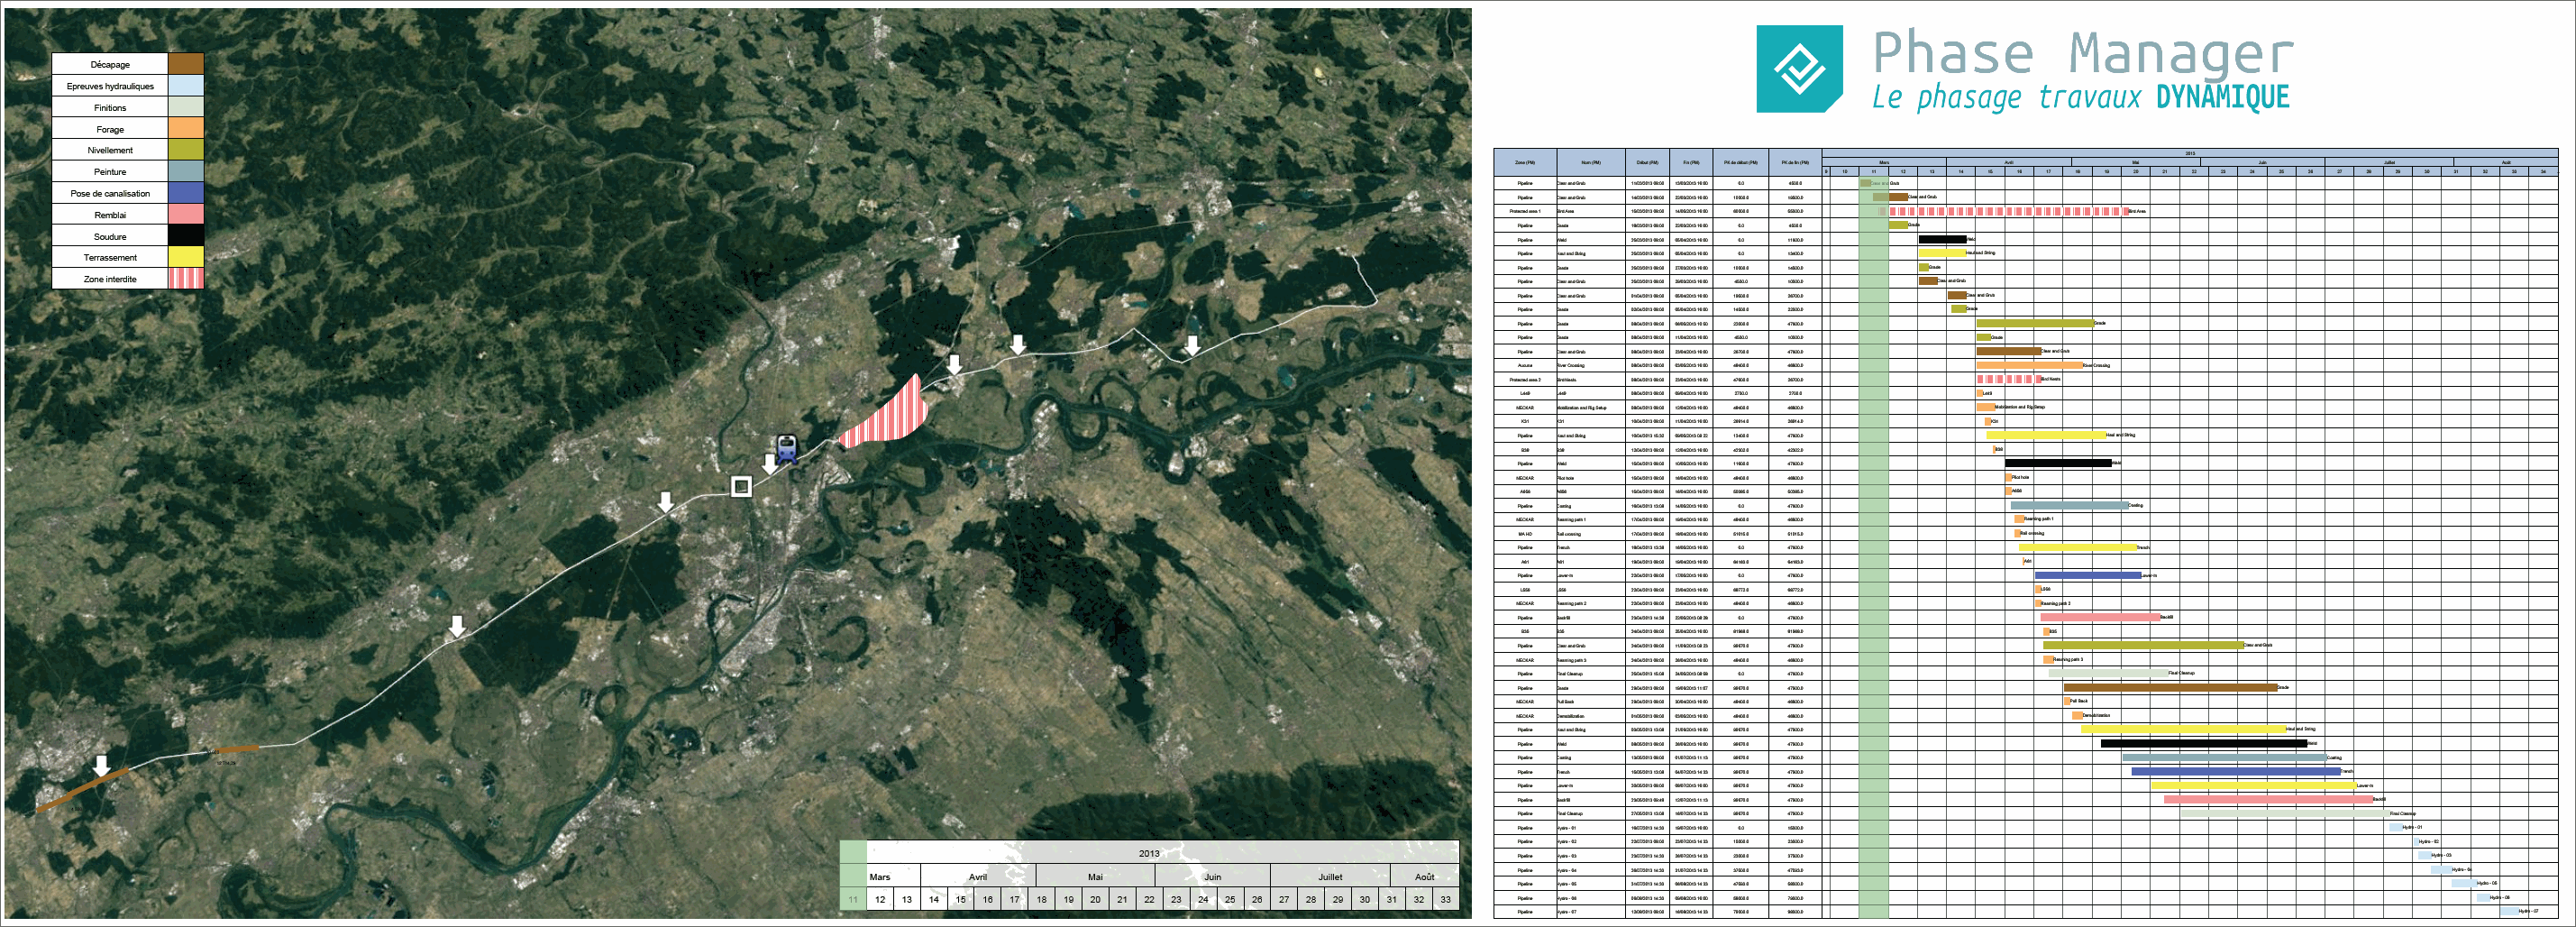
Weekly program of a Pipeline Section:
Project:
Construction of a 100 km pipeline that crosses roads, rivers, protected environmental zones and railways.
The work was scheduled in Tilos and this task data was transferred to Phase Manager.
To improve communication and to improve the understanding of the execution of the work, the planning was implemented in Phase Manager. This makes it easier to identify the interfaces between the trades and to identify the difficult interfaces. In addition, compliance with the nature conservation requirements can be checked and presented.
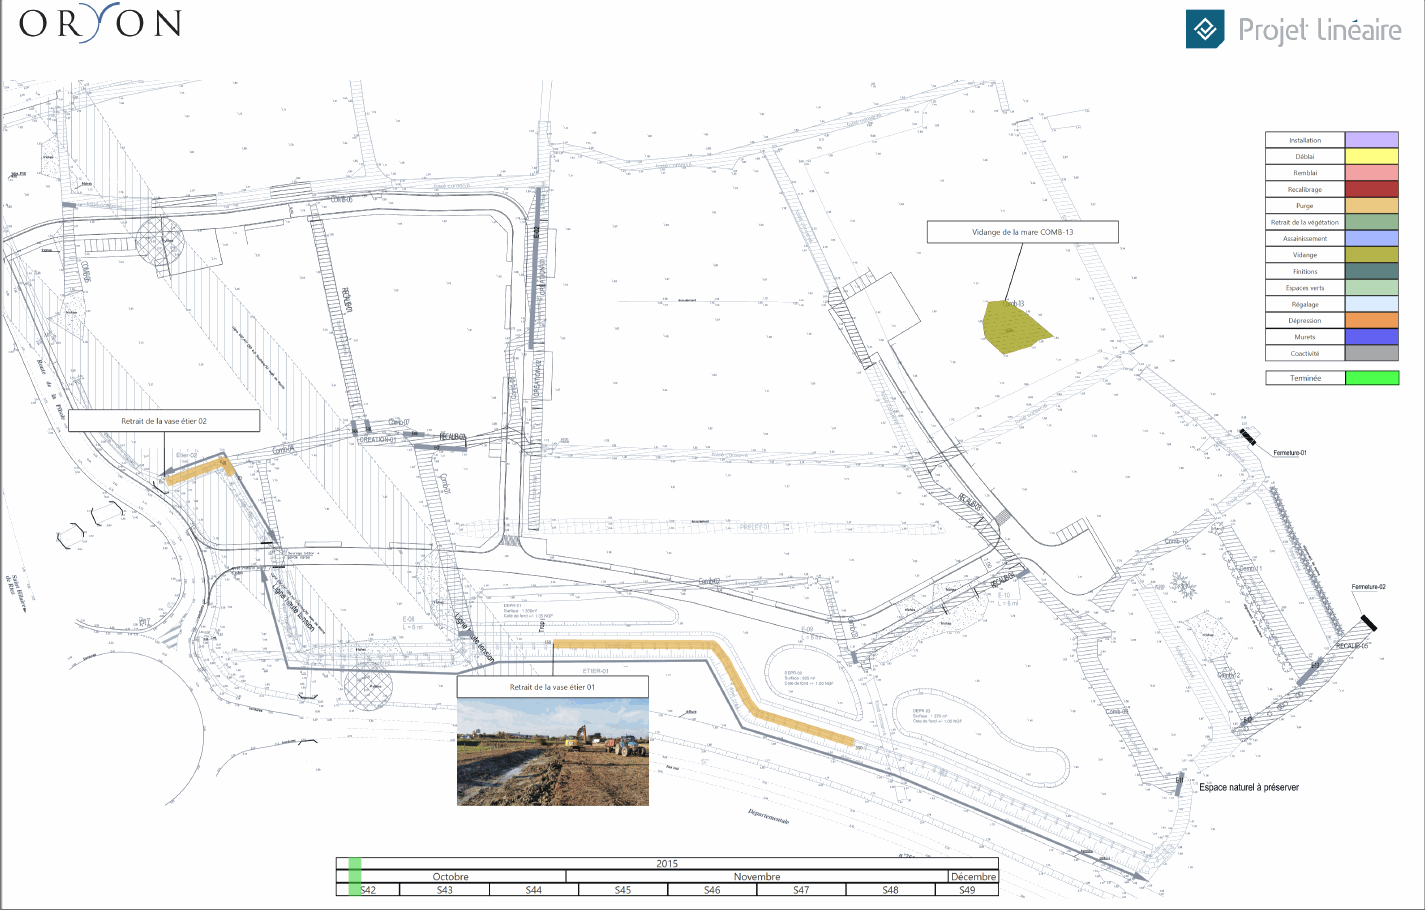
Development of a commercial area
Project:
As part of urban development policy, a new industrial park was to be developed. Based on the information in the construction diary, this plan represents the actual construction process.
The process information was taken from Excel data.