Convenient pricing of Turbo Chart
As of July 1, 2018, a new pricing model will be introduced for Turbo Chart: Previously, there was a perpetual license. The new licensing model is based on annual subscriptions to Turbo Chart. This offers users and newcomers decisive advantages:
- The entry price is very low: Even for 425 Euro (plus VAT), you can use Turbo Chart in your project. (As of 1 July 2018)
- Calculability: Once the project is completed, there are no further costs
- You also do not have to worry about managing maintenance contracts: The subscription automatically includes all updates within the runtime.
- Accounting simplification: The software product does not have to be activated in the balance sheet and goes directly and completely into the costs
There are also attractive volume discounts for the use of multiple licenses. Contact us.
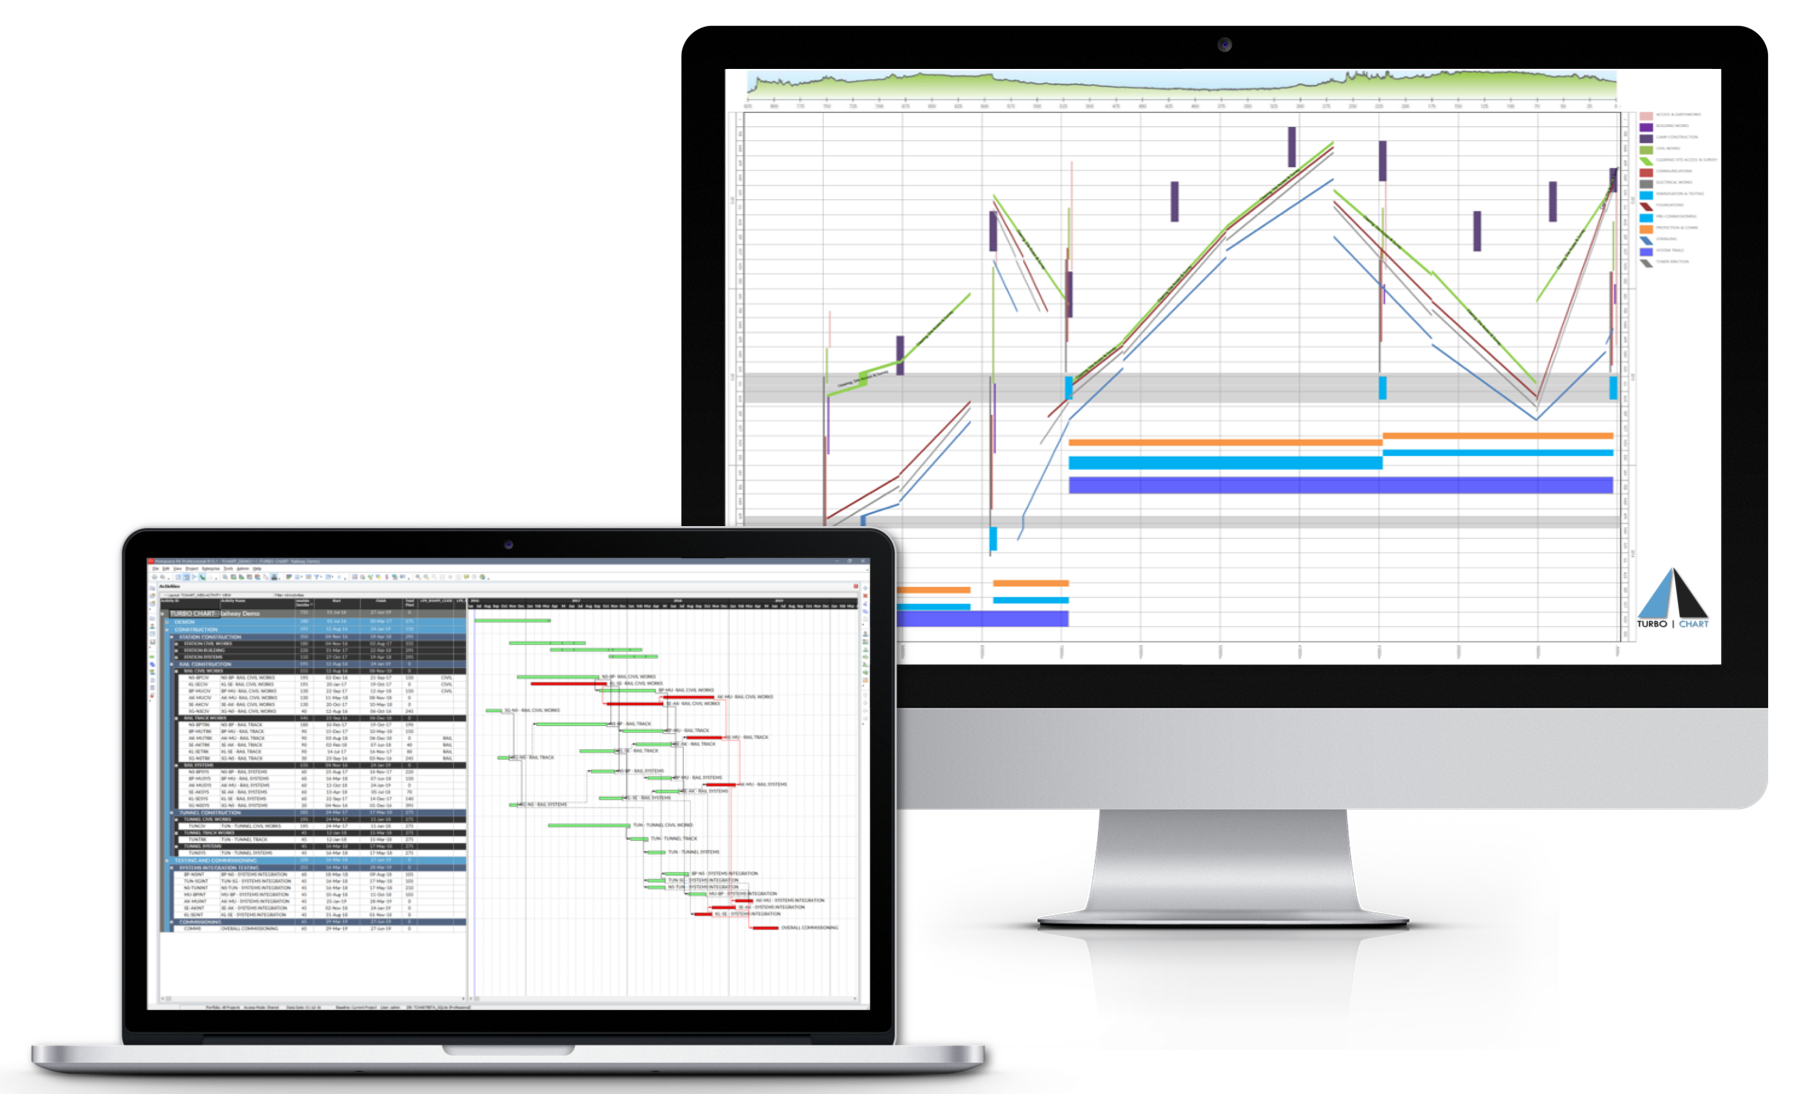
What is Turbo Chart?
Turbo Chart is a new software tool to create time-location-charts from bar charts. time-location-charts are used to representation schedules of linear construction projects in track construction, road construction, pipeline construction, etc. Turbo Chart is easy to learn and allows direct representation of activity data from Gantt systems, e.g. Primavera P6, Microsoft project, Asta powerproject. The update function makes it possible to visualize and check the schedule changes made in the Gantt chart – directly in the time-location chart. This gives you the advantages of both systems: Your usual scheduling system and the associated representation in thetime-location-chart.
What sets Turbo Chart apart from other Systems to create time-location charts?
There are already planning systems that can display scheduling in time-location charts. Including very good ones with a multitude of functions that facilitate the planning of linear construction sites. However, it usually takes a long time to get used to these systems. And you still have to master an additional scheduling program including specialist knowledge.
However, we have met many planners, calculators and schedulers, that state this effort is too large – or want to work out a time-location-chart very rarely.
This planners
- want an easy-to-learn and simple tool to visualize their existing schedules in a time-location chart..
- already work with scheduling tools such as Microsoft project, Primavera P6 or Asta powerproject.
Turbo Chart focuses on creating time-location charts based on your existing schedules. And it’s as easy as possible because it works in parallel with your favorite scheduling program. Turbo Chart has no advanced and sophisticated planning features for linear construction sites – but that’s what makes the Turbo Chart stand out: Turbo Chart is fast to learn and easy to use. You receive your results in a short time with very little effort.
Turbo Chart Trial
You can test Turbo Chart for 14 days for free. Download.