
Create Construction Phase Maps with Phase Manager: Animated Samples
With the tool Phase Manager you can create construction phase maps ("flipbook"). Construction phase maps show on the site plan, at which location, which work is carried out in [...]

Tilos training: Summer promotion 2018 – Create your schedules more effectively, we show how!
Tilos is a market-leading tool for creating schedules in the time-location-diagram. It has highly integrated functions and special display options for linear construction sites. The operation of this scheduling system [...]

New convenient pricing model for Turbo Chart
Convenient pricing of Turbo Chart As of July 1, 2018, a new pricing model will be introduced for Turbo Chart: Previously, there was a perpetual license. The new licensing model [...]

Tilos training: Individual courses for your entry into scheduling with time-location-diagrams
Why is Tilos training useful? The Tilos scheduling software for linear projects has exceptionally rich and specialized display and scheduling capabilities. There are four main focuses in the operation: General [...]

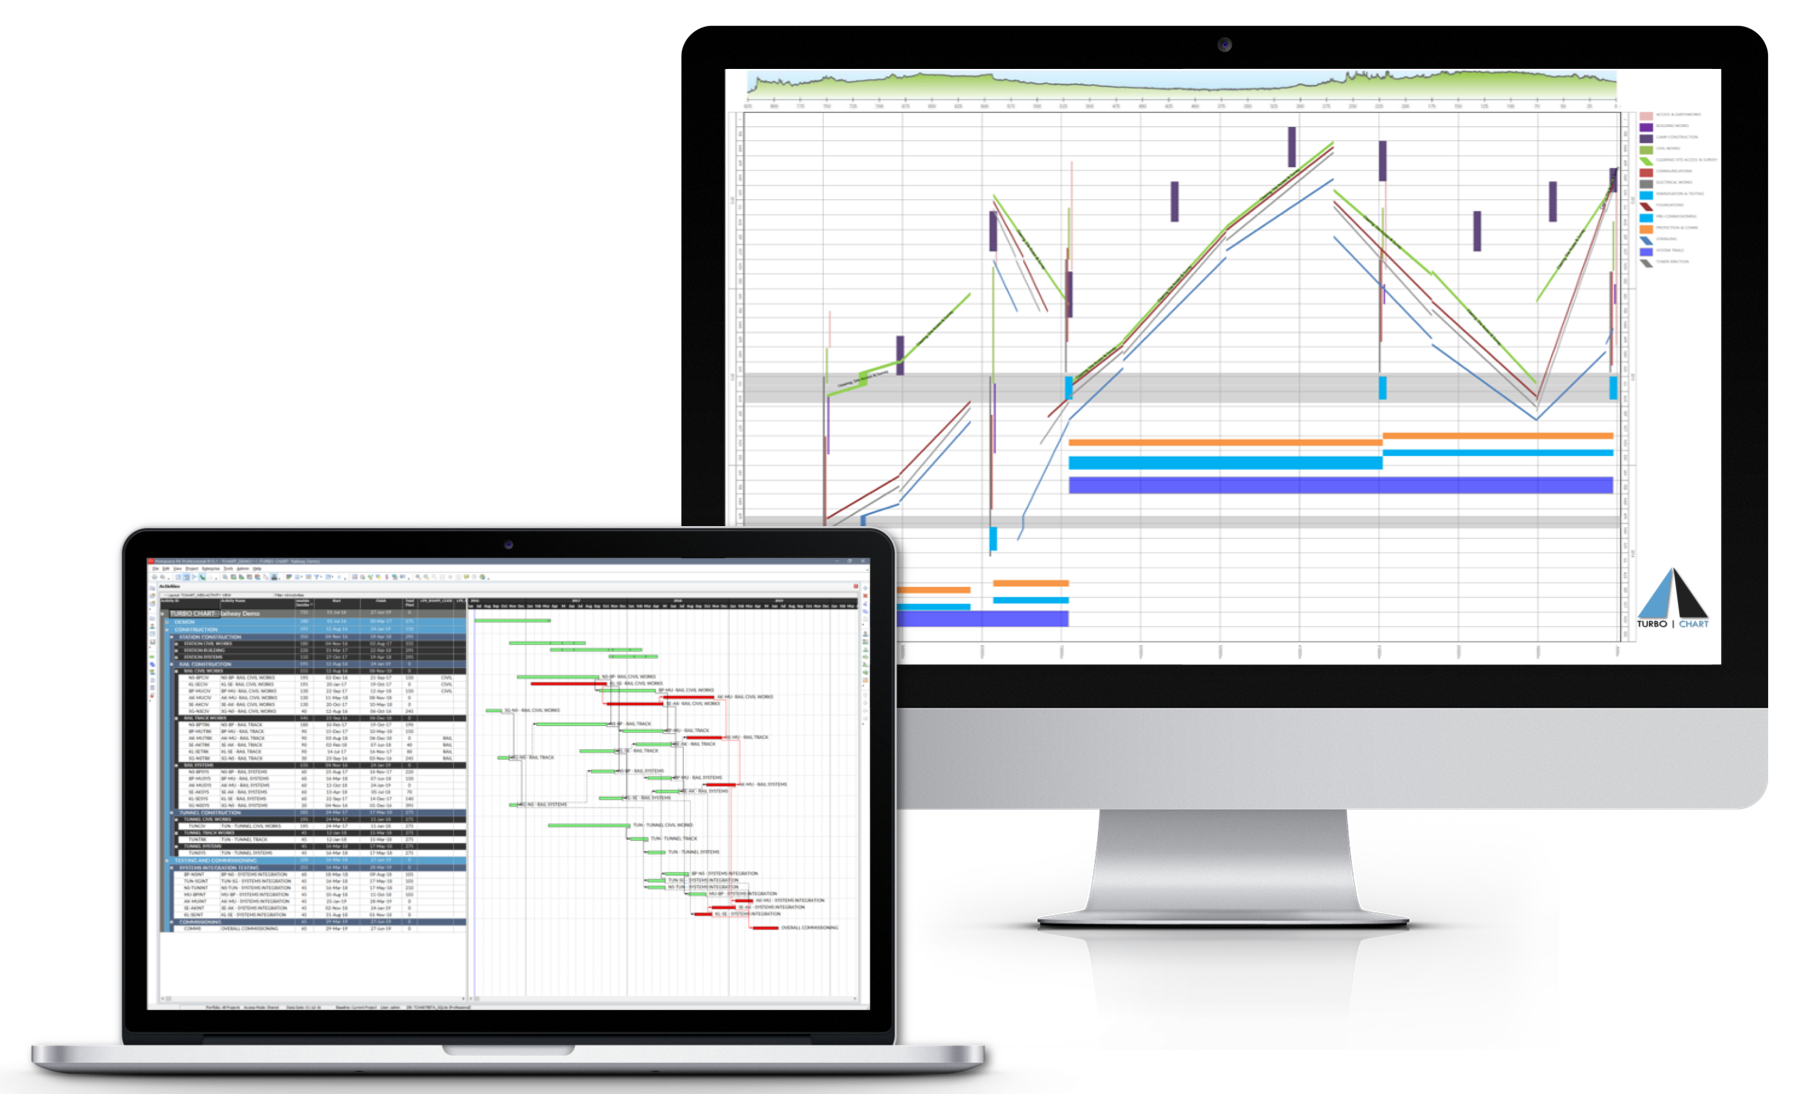
Time-Location-Charts in practice: Generated from the Gantt Diagram
Do you know this scenario from practice? The schedule of a traffic or linear construction project is available in the Gantt Diagram. Nevertheless, a Time-Location-Chart must be presented too. However, [...]
Results of a Tilos software training for road construction
Aktuell: Offenes Tilos Seminar in Karlsruhe am 29. und 30. Januar 2019 In dieser Woche gab Planavista eine zweitägige Tilos Software Schulung in der Abteilung Strassenbau eines bekannten Tiefbau-Unternehmens. [...]