Do you know this scenario from practice?
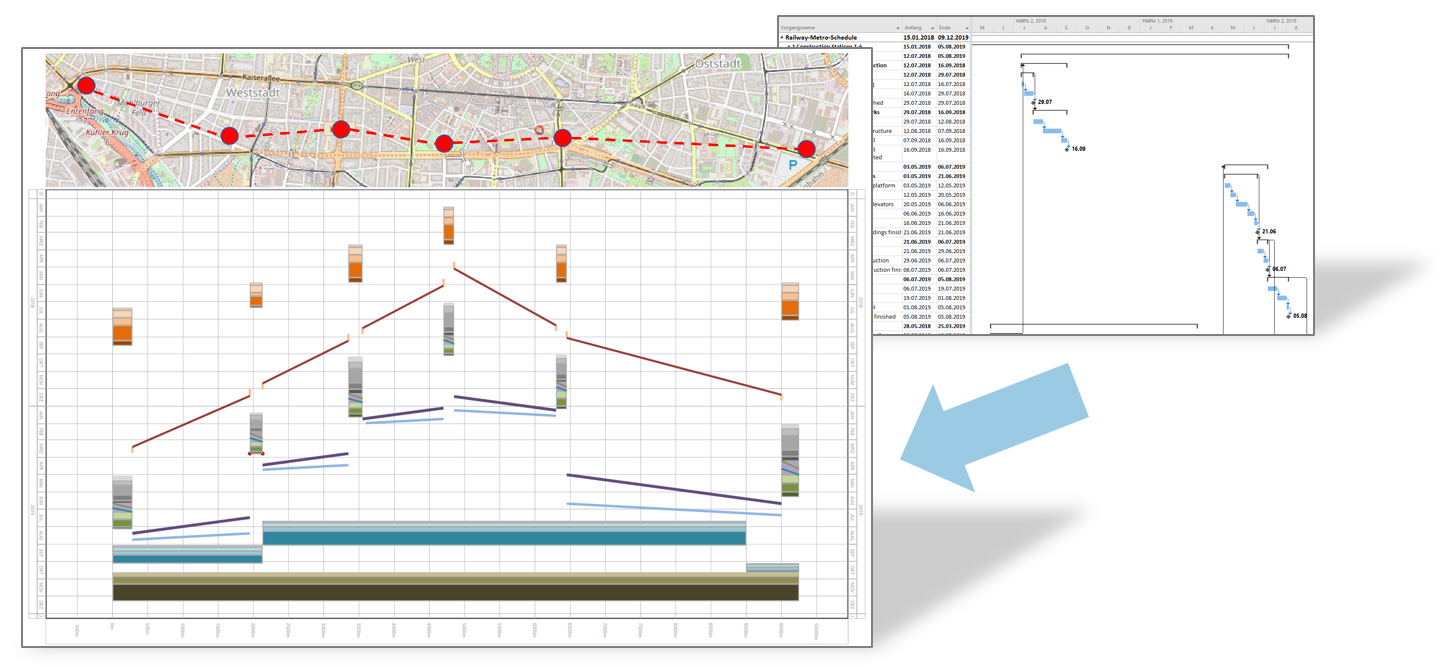
The schedule of a traffic or linear construction project is available in the Gantt Diagram. Nevertheless, a Time-Location-Chart must be presented too.
However, it takes too much time to transfer a schedule status into the Time-Location-Chart. Time you do not have and nobody wants to pay for.
Which tool do you use? There are a few possibilities: From manual plans created by the CAD colleague to highly complex scheduling systems for specialists. All these possibilities are complicated and time consuming. some are still inaccurate. Updates are then to be done in both plans, so there is duplication of work. How often do you have to update your schedules?
Not all Activities ae linear: Many organisational activities and Milestones are scheduled in the FGantt and are reported here. Those activities should not be transfered in the Time-Location-Chart. Although it must be guaranteed, that the Gantt-Schedule is consistent with the Time-Location-Chart.
The desire
The most effective you are working n the tool that you already know. For example, Microsoft project, Primavera P6 or Asta powerproject. Often one of these systems is also determined in the contract and you have to submit the schedule in this system anyway.
So why not generate a Time-Location-Chart from this Gantt schedule? This should work fast and easy. Every employee should be able to do this, even without training. After changes, the Time-Location-Chart should be able to be updated quickly at the push of a button from the gantt diagram. Best in seconds – and therefore stay up to date.
The solution
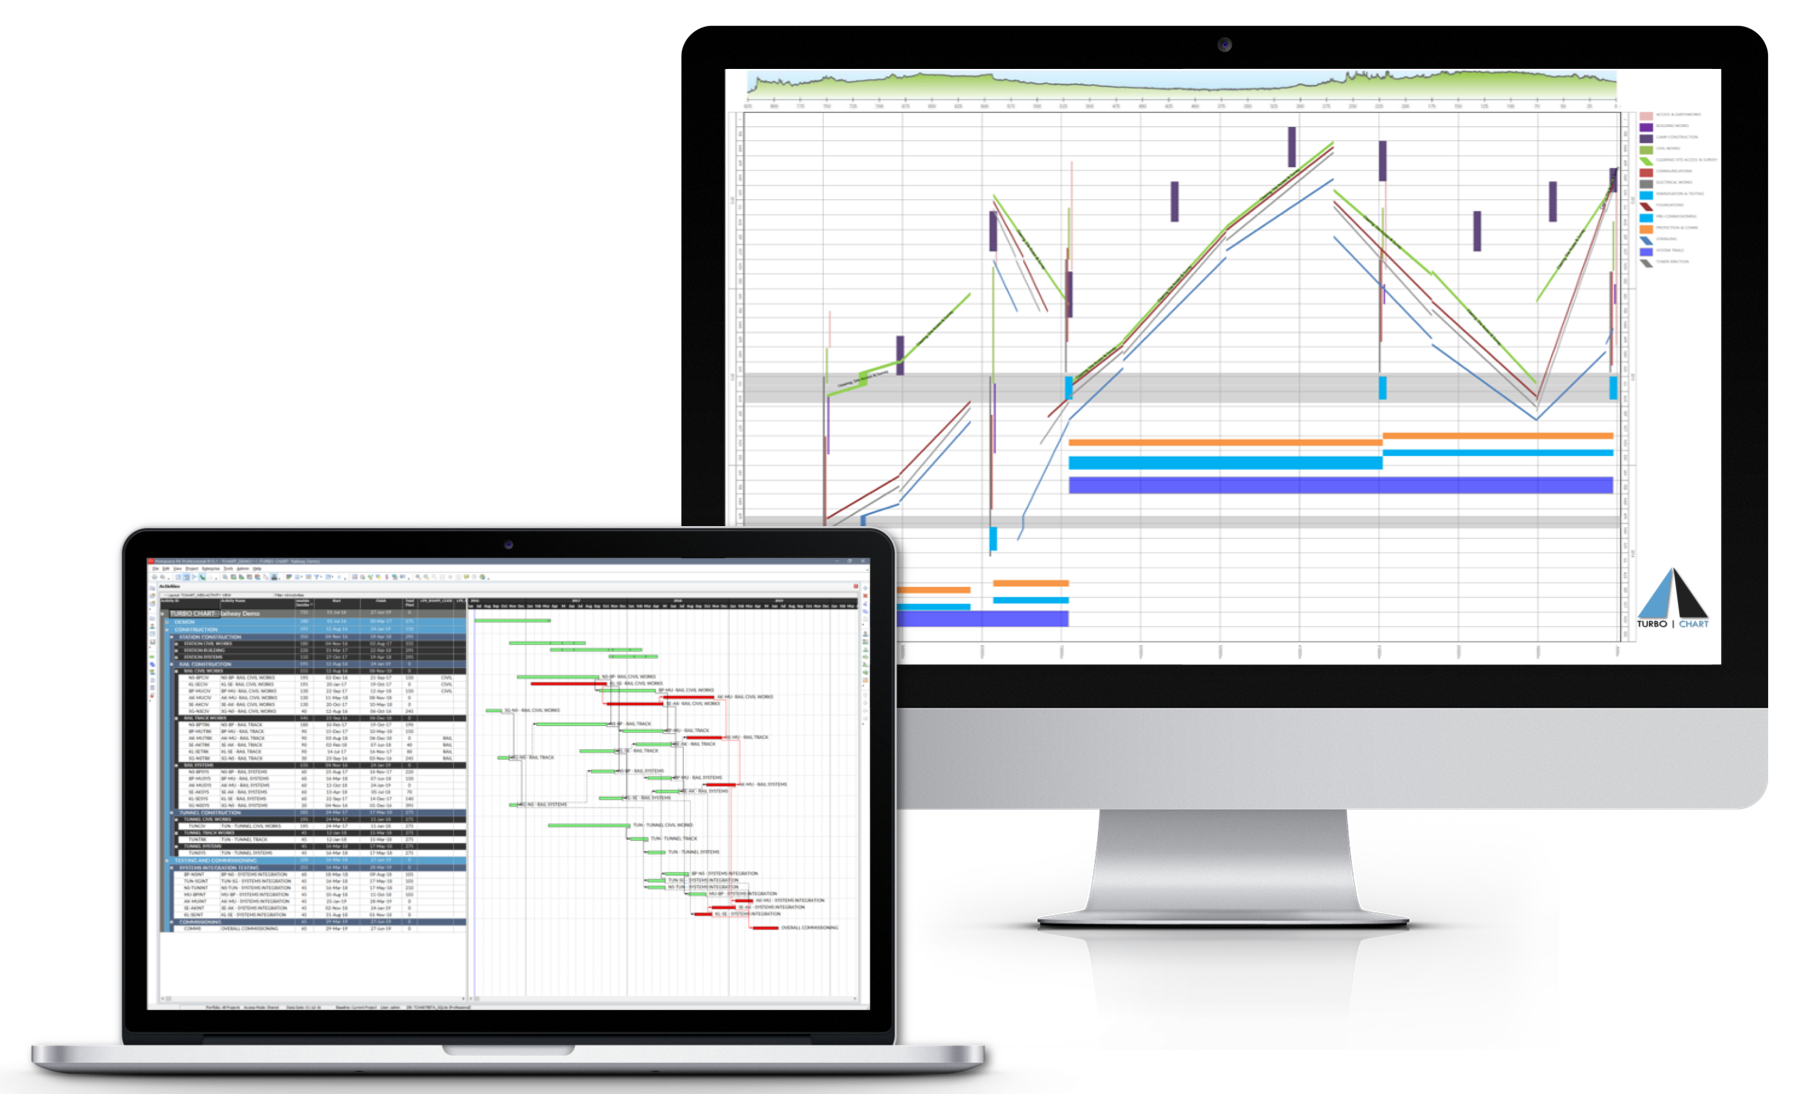
Turbo Chart is delivering just that. It has been specially programmed for this task: To generate Time-Location-Charts from existing schedules in an easy and fast way. Concentrating on this task also makes the usage of Turbo Chart so easy. One of the fathers of Turbo Chart is himself a longtime scheduler for line construction sites. Simple usage and fast results are ihis main requirements. When he did not find such a system, he decided to develop Turbo Chart. And thus also to offer all colleagues a solution for this previously difficult and time-intensive process.
The connection
There are direct interfaces to Primavera P6 and Microsoft project. Here you can read activity data directly from the database or the mpp file. TurboChart, however, can read activity data from any scheduling system that can output the activities as text lines: e.g. Asta powerproject and many others.
Watch and try it, Turbo Chart in action:
Short video clip: Creating Time-Location-Charts fast. (about 2 Min.)
https://www.youtube.com/watch?v=pwXUbsiQVTM&t=5s
Tutorial: Weg-Zeit-Diagramm aus Microsoft project erstellen: Mit Turbo Chart (German)
https://www.youtube.com/watch?v=z-JS6SYbiiA&t=54s
Download the Trial Version
https://turbochart.de/download